Break-Even Point in Units
Break-Even Point in Units
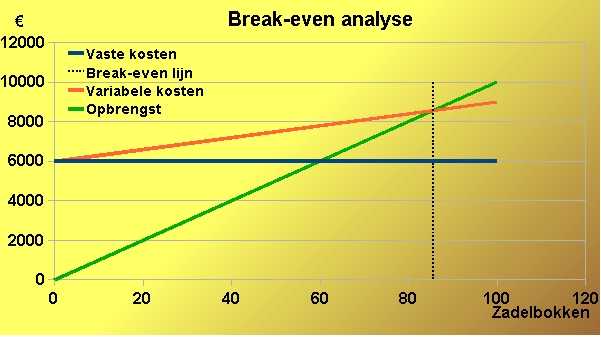
Break-even analysis answers a fundamental business planning question before a product ever launches: how many units need to be sold just to cover costs, with no profit and no loss? Every unit sold beyond that point contributes directly to profit, while every unit short of it means the business is still losing money overall.This simple formula drives real decisions — pricing strategy, production volume targets, and whether a product is viable at all given its fixed costs and margins. A product with a high fixed cost or a thin margin per unit (price close to variable cost) needs a much larger sales volume to break even, which is exactly the kind of red flag this calculation is meant to catch early.
The break-even quantity is Q_be = FC/(P − VC), fixed costs divided by the contribution margin per unit. where FC_cost is the total fixed cost, P_price is the selling price per unit, VC_cost is the variable cost per unit, and Q_be is the resulting break-even quantity, monetary values as plain numbers (dollars implied).
Inputs
FC_cost := 50000=50000
P_price := 25=25
VC_cost := 15=15
Divide fixed costs by the contribution margin (price minus variable cost per unit) — this margin is what each unit sold actually contributes toward covering the fixed costs.
Q_be := FC_cost/(P_price - VC_cost)=5000
Results
With $50,000 in fixed costs and a $10 contribution margin per unit, 5,000 units must be sold before the business turns a profit — below that volume it is still operating at a net loss even though each unit sold is individually profitable above its variable cost. Raising the price or cutting variable cost per unit both shrink the break-even quantity, which is why pricing and cost-control decisions are so closely tied to sales volume targets.
Assumptions & limitations
- Price and variable cost per unit are constant regardless of volume (no bulk discounts or price breaks).
- Fixed costs do not change with production volume within this range.
- All units produced are sold (no inventory buildup).
- Monetary amounts are plain numbers (dollars implied).