Standard Normal Z-Score
Standard Normal Z-Score
A z-score answers a very practical question: how unusual is this particular measurement compared to the rest of the population? By rescaling a raw value into "number of standard deviations from the mean," z-scores let you compare apples to oranges — an exam score, a part dimension, and a lab result can all be judged on the same scale once converted to z.Quality control charts, standardized testing, and outlier detection all lean on this same idea. A z-score near zero is unremarkable; a z-score with |z| beyond about 2 or 3 flags a value that would be rare under a normal distribution and often triggers a closer look — a failed part, a miscalibrated sensor, or a genuinely exceptional result.
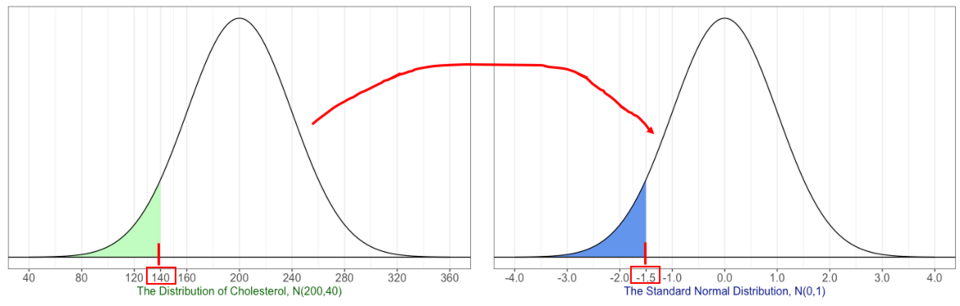
The z-score is z = (x − μ)/σ, the number of standard deviations a value sits above or below the mean. where x_val is the observed value, mu_val is the population mean, and sigma_val is the population standard deviation.
Inputs
x_val := 82=82
mu_val := 75=75
sigma_val := 8=8
Subtract the mean to see how far the value sits from the center, then divide by the standard deviation to express that distance in "sigma" units rather than raw units.
z_score := (x_val-mu_val)/sigma_val=0.88
Results
A z-score of about +0.9 means the value sits under one standard deviation above the mean — well within the ordinary range, not an outlier. Under the empirical 68-95-99.7 rule for a normal distribution, about 68% of values fall within |z|<1, 95% within |z|<2, and 99.7% within |z|<3, so this result is unremarkable. Values with |z| beyond roughly 2 are the ones worth flagging for review.
Assumptions & limitations
- Underlying population is approximately normally distributed.
- μ and σ are known (population, not estimated from a small sample).
- No probability/CDF is computed here, only the standardized distance.