3D surfaces
Put a 3D surface on the page when the question has two inputs. How a plate
deflection varies with both spans. How an efficiency changes with speed and
pressure. Plots → 3D Surface inserts its own region type. You
do not type the formula on the plot. Assign z (or any
name you like) on the sheet, then tell the surface which variable to plot and
how to sweep its two inputs.
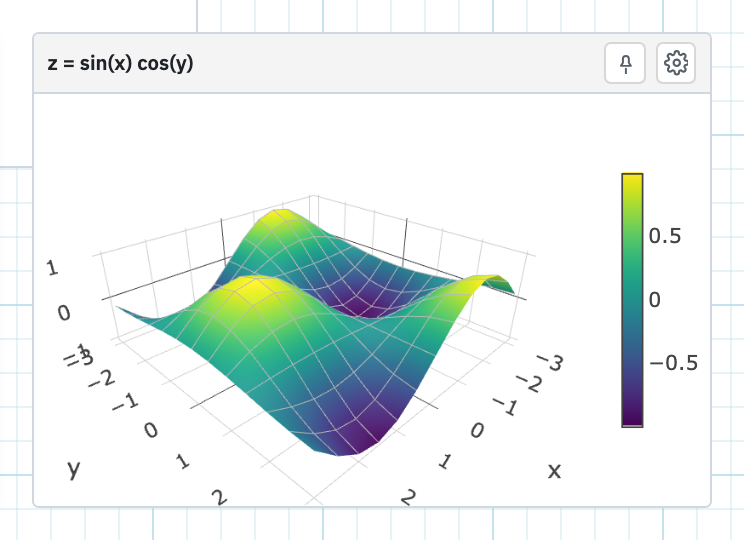
Define z on the sheet
Above the plot, write an assignment in terms of two independent names.
Commonly x and y:
z := sin(x) * cos(y) =The two input names only have to exist so the plot can sweep them. Whatever single value they hold is irrelevant, because the surface substitutes each sample pair of its own during evaluation.
Set up the surface
- Open the Plots tab, choose 3D Surface, and click the page.
- If the panel is closed, click the gear, labelled Edit surface. The canvas hides while the panel is open.
- Set the fields below, then click the gear again to draw.
- Evaluate the sheet so
zis in scope.
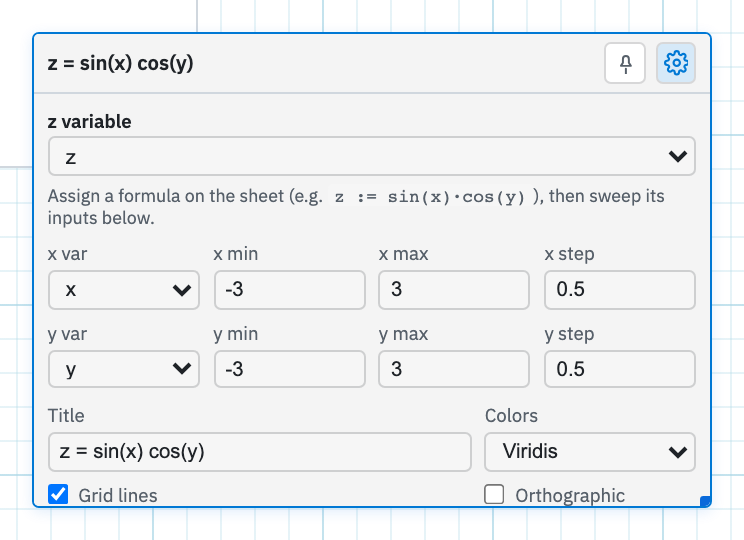
What the panel controls:
- z variable is the sheet assignment to plot. The hint on the panel repeats the pattern: assign a formula on the sheet, for example
z := sin(x)·cos(y), then sweep its inputs below. - x var, x min, x max, and x step set the first independent variable and its sample grid. x step is the spacing between samples, with a maximum of 80 points along the axis.
- y var, y min, y max, and y step do the same for the second axis, also capped at 80 points.
- Title is optional and appears on the region toolbar, which otherwise reads 3D Surface.
- Colors chooses the colour scale: Viridis (the default), Cividis, Portland, Jet, Hot, Earth, or Greys.
- Grid lines, ticked by default, draws the wireframe mesh over the shaded surface.
- Orthographic, off by default, switches to parallel projection so there is no perspective foreshortening. Useful when you want to read heights off the plot rather than admire it.
Orbit, zoom, and pin
- With pin mode off, which is the default, drag to orbit, scroll to zoom, and use the Plotly pan, orbit, and home controls on the canvas.
- The pin button toggles pinning. With it on, clicking the surface pins a callout showing x, y, and z, instead of orbiting. Click a callout to remove it.
- Right-click the region and choose Remove all pins to clear every callout at once.
There are no Line / Area / Scatter tabs here. Resize with the region handles
instead, and the surface redraws whenever you evaluate or change the sweep
grid. The z assignment has to sit above the surface in
evaluation order. For a 2D line
or scatter of the same formula, use
2D plots instead.