Polar plots
Reach for a polar plot when the independent variable is an angle: a wind pressure coefficient around a circular tank, a bolt group force by position, an antenna or acoustic pattern. The Polar plots group on the Plots tab offers Line, Area, and Scatter. Underneath, this is the same series machinery as 2D plots, with angle and radius standing in for X and Y.
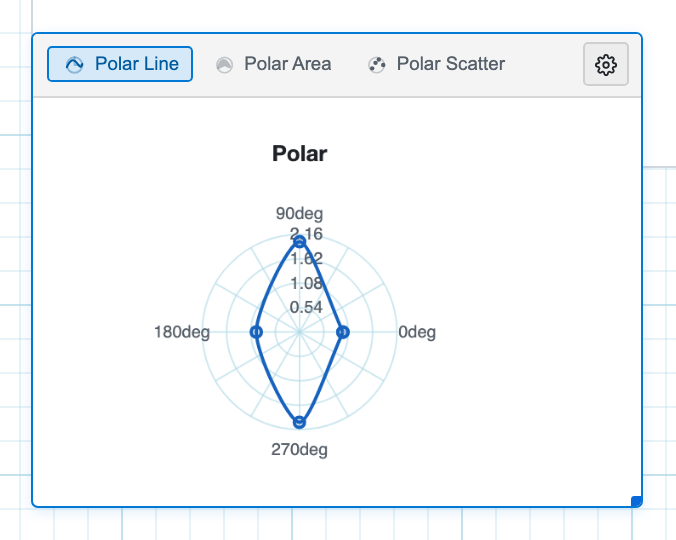
Place and bind
- On the Plots tab, pick a polar type and click the page.
- Configure opens. The top-row placeholders read Chart title, Theta axis, and Radius axis rather than X and Y.
- Bind each series with Sweep, Data, or List, exactly as on an XY chart. Only the field labels change: Theta and Radius, or theta and r in the leftover function fields.
- Click the gear to hide Configure and draw the chart, then evaluate the sheet.
Which angle units are read
In List and Sweep mode the angle carries whatever unit the worksheet variable
has, so deg is converted for you. In Data mode there is no unit to
read and the numbers you type are taken as radians. That is why the
Theta-values placeholder is 0, 1.57, 3.14, 4.71, a full circle,
against a Radius-values placeholder of 1, 2, 1, 2. If you have
degrees stored as bare numbers, attach the unit before plotting:
theta := to(linspace(0, 360, 73), "deg") =
r := 2 + cos(2 * theta) =
Or stay in radians throughout and skip the conversion:
theta := linspace(0, 2 * pi, 73) =
r := 2 + cos(2 * theta) =
Either way, set the series to List mode with Theta variable theta
and Radius variable r, and you get the four-lobed rose at 5-degree
resolution.
When Sweep earns its keep
Sweep behaves as it does on an XY chart. Pick an input already defined on the sheet, set from, to, and step, and pick the output to read as the radius. Prefer it over List when each radius comes out of a full sheet evaluation, so anything downstream of the angle — a frame result, a solve, a unit conversion — is recomputed at every point. Data mode remains the quick route for a handful of measured directions: two comma-separated lists, Theta values and Radius values, the same length.
Switching between the polar types
The toolbar tabs stay inside the polar family: Polar Line, Polar Area, and Polar Scatter. Switching between them keeps the series bindings, so it costs nothing to try the filled version of a pattern. There is no tab that jumps to an XY line, a bar chart, or a 3D surface. Each of those is a separate region inserted from the Plots ribbon. Pins work as they do on an XY chart. Click a point to drop a callout, click the callout to remove it, or right-click and choose Remove all pins.