Sweep tables
Insert a sweep table when you want the same question answered at a series of values. What is the reaction, the deflection, and the utilisation at every span from 4 m to 12 m? Insert → Sweep places that table. You name one input to vary, give it a range, and list the outputs to record at each step. The region toolbar reads Parametric table, and the gear is Configure.
This is the tabular cousin of a plot series in Sweep mode. A chart wins when the shape of the response is the point: where the curve turns, where it flattens. The table wins when someone will read numbers off it. A checker verifying one row. A schedule that goes into the appendix. Any case where three or four outputs have to be compared at the same input value.
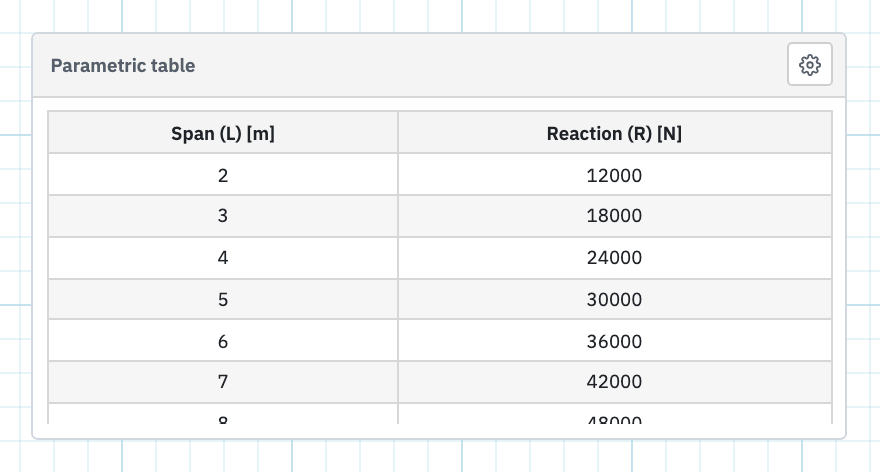
Place a sweep
- On the Insert tab, choose Sweep, then click the page.
- Configure opens straight away. The finished table stays hidden until you close the panel.
Set the input range
The first section of the panel is titled Sweep. Its hint states the behaviour: vary the input variable from From to To by Step. The sheet is re-evaluated at each value.
- Input variable picks a name that already exists on the sheet, using the same dropdown as a plot sweep.
- Input column heading is an optional title. Its placeholder spells out the rule: optional title — variable name always shown.
- From, To, and Step set the range, starting at 0, 10, and 1. Step must be greater than zero.
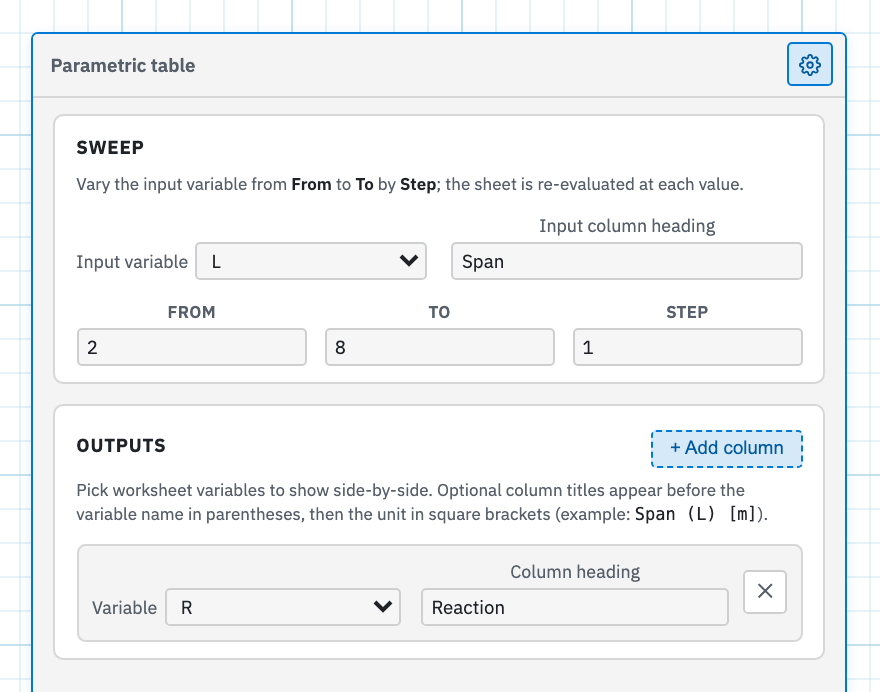
Choose the output columns
The second section is titled Outputs, hinted as: pick worksheet variables to show side-by-side. Each row pairs a Variable dropdown with a Column heading, using the same optional-title placeholder. + Add column appends another output and the ✕ (Remove column) drops one. Closing Configure with the gear fills the table. A brief Loading… and then Computing sweep… appear while the rows evaluate.
Leave a heading blank and the column shows the variable name and its unit. Set
one and you get Heading (name) [unit]. The panel's own example is
Span (L) [m]. The unit is whatever the variable currently carries
on the sheet, so it follows the calculation rather than the table.
What happens at each row
Build the sheet above the sweep exactly as you would for a single run. For each row the sweep temporarily assigns its own value to the input, re-runs everything downstream of that assignment, and records the outputs. Put the sweep below the formulas it depends on, and above anything that should read from it. Frame results, names produced by Given/solve, and list variables all work as outputs provided they sit above the sweep and depend on the input.
A sweep cell is not a name you can reference in math. If you need the number downstream, plot the same variables or copy the value across by hand. Drawing a curve of one output against the input means a Line chart in Sweep mode with the same input, range, and output, or arrays built in math and bound with List mode. The table and the chart evaluate independently and share no cache.